Health & Fitness App Users Are Going the Distance with Record-High Engagement

By: Lali Kesiraju, Analytics Manager and Toby Vogels (@tobyvogels), Developer Evangelist

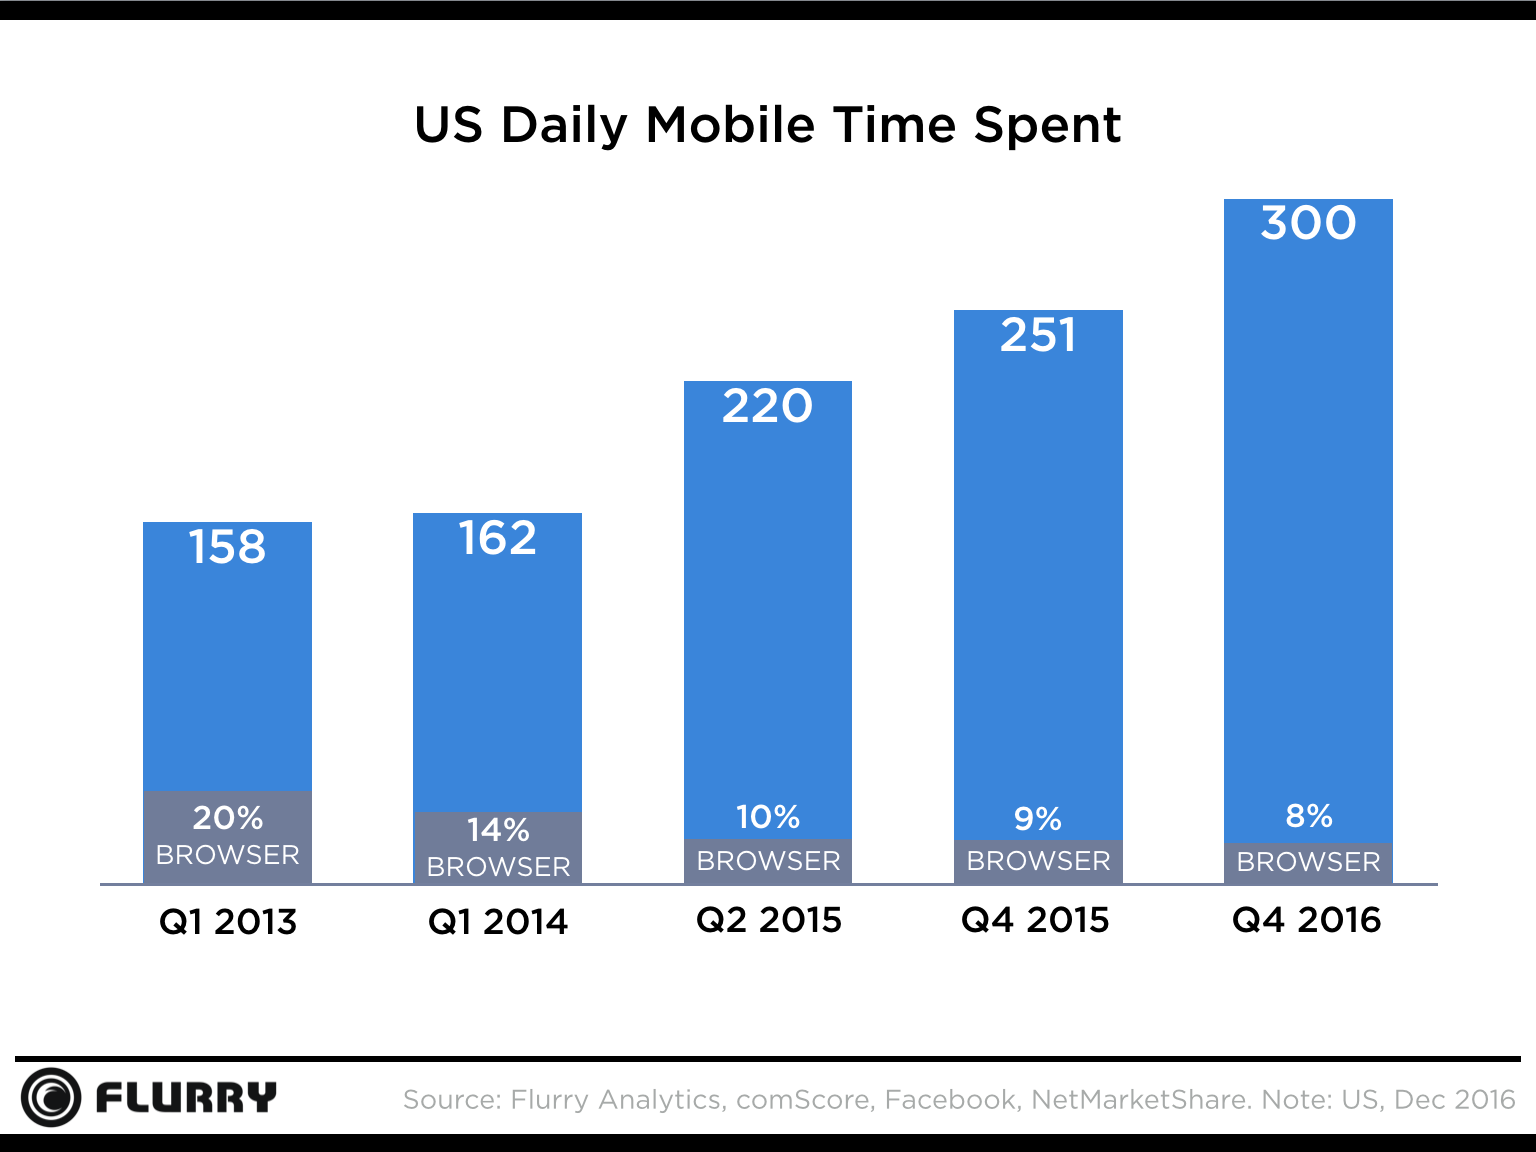
As smartphone users have diversified their app usage, health & fitness apps have become a vital tool to make our lives healthier. In the last three years, health & fitness app usage grew by over 330%. Users are continuously tracking workouts, signing up for classes, and keeping in touch with their general health. We took a closer look at current trends and opportunities for health & fitness app developers.

At Flurry, we reviewed the health & fitness app industry based on app usage (Flurry, now part of Oath, tracks over 1,000,000 apps across all app categories, providing insights into 2.1 billion devices). To investigate current trends, we examined health & fitness categories combining iOS and Android data.


Users are Highly Committed to Their Fitness Apps

Flurry data shows that of active health & fitness app users, 96% are using only one health & fitness app. As seen in our app loyalty matrix, health & fitness apps show the highest retention rates across all categories. This indicates that users are dedicated to their fitness apps once they start using them.

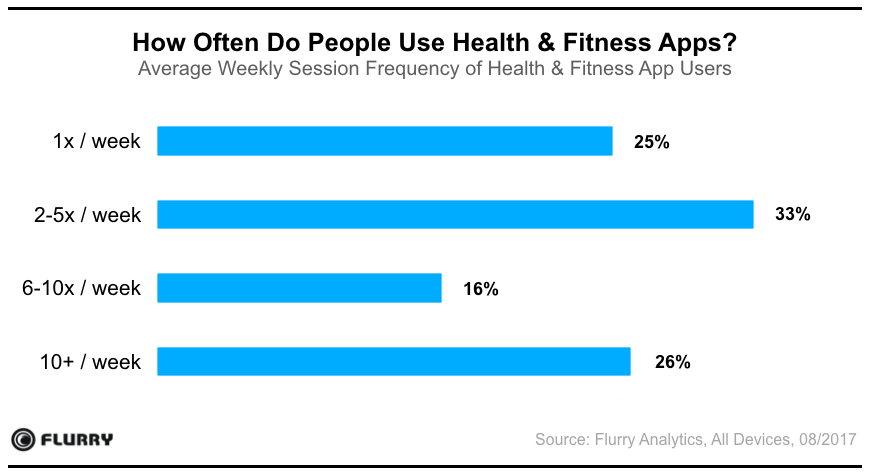
Over 75% of active users open their health & fitness app at least two times a week. Also, there is a remarkably high percentage of Fitness App Addicts: more than 25% of users access their fitness apps more than 10 times a week. As a result, this frequency of usage drives up overall category engagement. For app developers, this presents an attractive opportunity to capitalize on users’ frequent engagement and boost monetization.


Average Weekly Session Frequency


Year-Over-Year Growth is Slowing Down

Since 2014, we have seen massive growth in the health & fitness app category. In just three years, usage grew by over 330%. However, since 2016, growth has slowed down: while we saw a year-over-year growth of 178% from 2014 to 2015, the health & fitness app category only grew by 9% from 2016 to 2017. This correlates with the trends of the overall app industry.

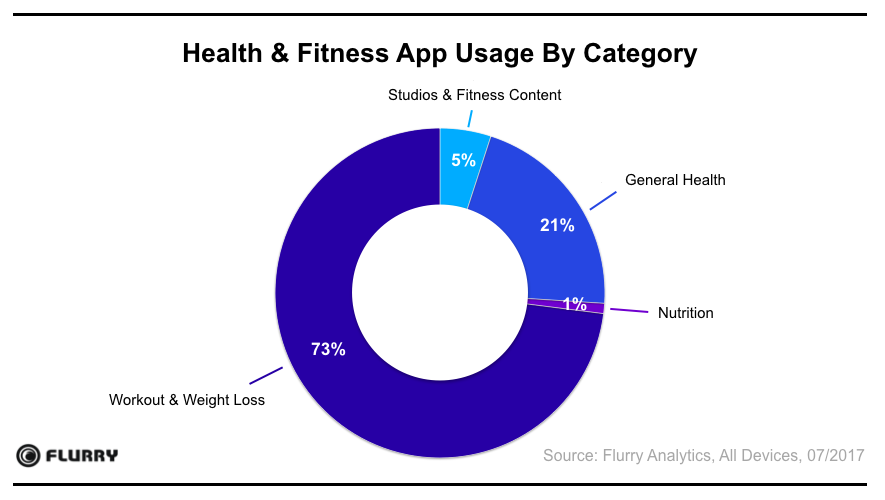
To understand this slowdown in more detail, we segmented the health & fitness market into four sub-categories: Workout & Weight Loss, General Health, Nutrition, and Studios & Fitness Content.


Mobile Health & Fintess App Sessions Grow 9% Year-Over-Year


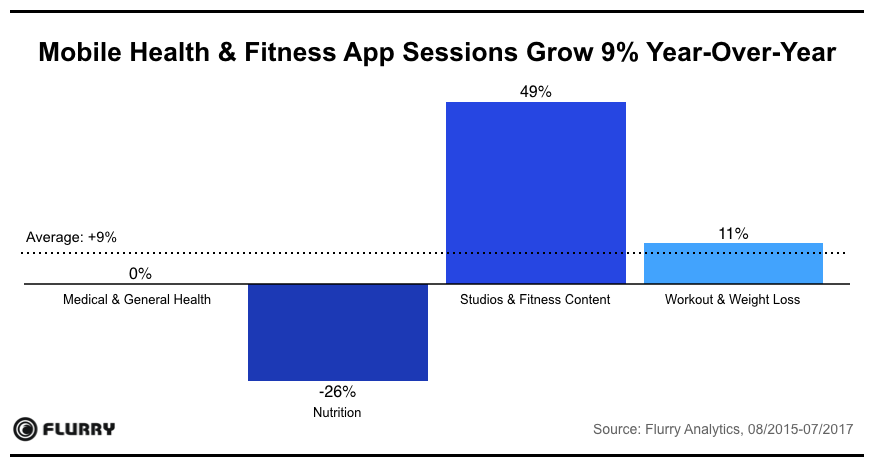
The largest subcategory, workout & weight loss, shows a significantly slower growth than in the previous year: year-over-year growth is down from 67% in 2015 to 11% in 2016. The other major subcategory, general health, revealed stagnation in the last two years. While nutrition apps declined in the last year, we still see a 49% growth for studio & fitness content apps. The negative trend of nutrition apps is likely influenced by studio & fitness content apps that are offering nutrition content in addition to their core focus.


Track, Set, Go: Workout & Weight Loss Apps Gain Market Share
Workout & weight loss apps account for 73% of all health & fitness app sessions. This represents a substantial gain from a 55% share in 2014. Working out and tracking weight loss are key use cases for health & fitness app users. While general health apps still held a usage share of 41% in 2014, workout & weight loss apps have eaten away large portions of it within the last three years. Wearables, such as fitness bands and smartwatches, have been key growth drivers for that development. According to Kantar Worldpanel ComTech, 15.6% of consumers owned a smartwatch or fitness band in December 2016.


Health & Fitness app usage by category


Apps are no longer optional for Fitness Studios and Health Clubs

Studio & fitness content apps registered the largest percentage increase in the category: Since 2014, studio & fitness content apps grew by over 830%. In 2014, studio & fitness content apps were accountable for 2% of all health & fitness sessions. By 2017, the share increased to 5%. Users continuously declared that they want to arrange their studio visits through a mobile application. This trend makes it crucial for gyms and studios to offer an app that lets their users conveniently schedule their workouts and classes.


Fitness App Usage Correlates with Seasonal Workout Habits

Fitness app usage can be described as highly seasonal: in the last months of a year, fitness app usage declines and hits rock bottom when the holidays approach. December 25th marks the lowest activity with 57% less usage than the most active day of the year, which is August 8. Usage picks up again in January after users have made their New Year’s resolutions and set their fitness goals for the coming year, and it builds up toward the summer, peaking in August. In the last three years, August has always been the most active month by an average of 23% higher usage than the yearly average. From September on, usage decreases again toward the holiday season.


Health & Fitness App Usage Soars on Weekdays


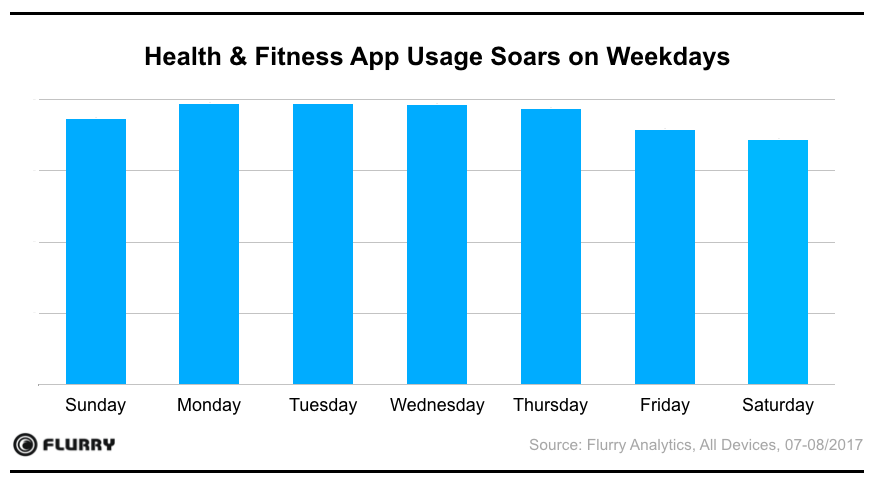
Fitness app activity throughout a week strongly aligns with user workout habits. Users are most motivated to work out from Monday through Wednesday. Once the weekend nears, app usage declines; Saturday marks the lowest activity by 10% fewer sessions than the weekly average.


Health & Fintess App Usage Peaks in the Morning and Evening


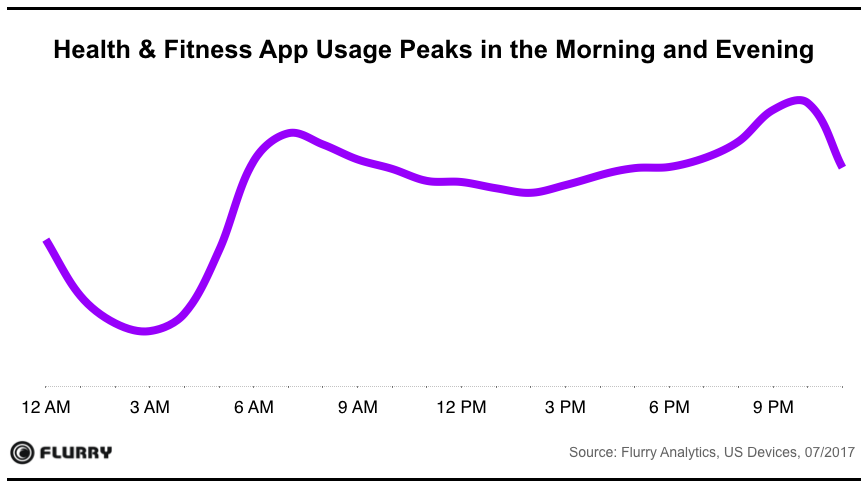
Flurry data shows that health & fitness app usage peaks in the morning and evening. People work out before or after heading to work. According to Fitbit, the busiest gym workout times are between 9-11 am and 5-8 pm. Surprisingly, the highest app usage period occurs at around 10 pm. While some people are doing a late-night workout, others might be reviewing their daily activity or planning their next day. For developers, this represents a unique opportunity, as this is a rather unusual peak time for engagement. App developers can leverage the higher engagement for specific marketing and re-engagement tactics.


The future of health & fitness apps and tips for app developers
Health & fitness app users are the most loyal users in the app industry, with high retention rates, engagement, and frequency of usage. A significant share of heavy users with more than ten sessions per week drives constant engagement. That makes this market segment very attractive for app developers. On the other hand, it can also be hard to acquire active users given people typically stick to one fitness application. Fluctuating engagement levels make it crucial for developers to focus on peak times during weekdays in the morning and evening.

Gartner forecasted that there would be over 310 million wearables sold in 2017, which would be an increase of 16.7% to 2016. A study from PwC shows that the number one reason for people purchasing a wearable device is health. This indicates a substantial growth opportunity for health & fitness app developers in the next year.

Play Longer, Spend More: Gamers Become Serious About Mobile

By: Toby Vogels (@tobyvogels), Mobile Developer Evangelist


Gaming has been a crucial part of the mobile industry since the launch of the App Store in 2008. For seven years in a row, gaming apps have been used more than apps from any other category. Consequently, mobile gaming has truly shaped how we engage on our smartphones today. However, since 2015, gaming sessions have been on the decline. Does that indicate the end of the mobile gaming era?

At Flurry Analytics, we reviewed the gaming industry based on app usage (Flurry Analytics tracks over 940,000 apps across all app categories which provides insights into 2.1 Billion devices). To investigate current mobile gaming trends, we examined gaming categories combining iOS and Android data and bundled related gaming categories together.


Who are the heavy gamers?

The top 5 mobile gaming countries (United States, India, China, Brazil and Russia) are driving 50% of all global gaming sessions. While the United States, India, and China take the top positions for gaming sessions, other countries are also showing a growing percentage of gaming addicts. For example, the United States accounts for 20% of all gaming sessions globally, but only 13% of all U.S. app sessions are games.

Top 5 Mobile Gaming Countries

According to Electronic Entertainment Design and Research, users who are spending more than 5 hours per week in mobile games in North America are 52% female, 38.6 years old, and use both a smartphone and a tablet for gaming in 60% of all cases. While the real gaming addicts are in Europe (users in Netherlands and Sweden spend both 31% of all their app sessions in games), these countries don’t have a significant attribution to the overall global gaming sessions. In fact, Netherlands only accounts for 2% and Sweden for about 1% of all global gaming sessions.


Key Gaming Categories in Decline

For the second year in a row, gaming sessions are declining year-over-year. Three years ago, arcade, casual and brain games were driving 55% of all gaming sessions. Since then, we have seen substantial declines in two of those categories: arcade and casual games. Arcade games, which accounted for 24% of all gaming sessions in 2014, decreased by 34%, and casual games by 50%. The declines of those two very large gaming categories were a key factor for the overall game session downturn within the last two years. A lot of those sessions simply dropped and were not spent in other gaming categories.

Year-Over-Year Gaming Session Growth


Are there any winners in a time of declines?

While mobile gaming sessions have declined by 10% year-over-year, some categories continue to gain traction in usage. This year, card & casino apps reached a spot in the top three gaming categories. Sessions grew by 22% since 2014, and the category now accounts for 15% of all gaming sessions. Separately, the growth of smaller app categories is driving diversification for the industry. For example, board and strategy games grew 29% year-over-year from 2016 to 2017 and sessions are up 80% since 2014. This rise increased the category’s session share of all gaming apps from 1.6% to 4.0%.

We have also identified similar trends in other smaller categories such as racing. Racing grew by 26% year-over-year and increased its game app session share from 1.6% in 2014 to 2.1% in 2017.


Fewer but longer gaming sessions

Flurry data shows that time spent in gaming apps has remained steady over the last year (+1%). The average US consumer spends 33 minutes per day in mobile games, and our data showed that the average session length grew from 6 minutes and 22 seconds in 2016 to 7 minutes and 6 seconds in 2017. This is a significant advance, considering that the average session length never exceeded 6 minutes in 2014 or 2015. Additionally, the latest year-over-year session length growth equals an increase of 44 seconds (+12%) per session, which indicates higher in-game user engagement than in previous years. These statistics reveal that while more gamers open gaming apps less often, they often spend more time playing games during each session.


Size DOES Matter

In the gaming industry, one thing remains true: the bigger the screen, the greater the engagement.

Screen Size Correlates with Gaming Session Length

When users play on-the-go, they take their medium-sized phone or phablet. However, if they’re purposely dedicating time out of their day to mobile gaming, they are more likely to pick up their full-size tablet device, which explains average session lengths of over 10 minutes on full-size tablets.

With regard to the hours of the day that are most popular for on-the-go versus on-the-couch gaming, tablet gaming showed a steady peak in the morning. Most users carry their phone with them during the day, especially in the morning as they commute to school or work, so this is when many gamers play on-the-go. On the other hand, the use of tablets for couch gaming peaks in the evening, as more users log in from the comfort of their couch or bed. While gaming time on the phone still peaks in the evening, it’s important to consider that overall phone usage peaks at that time as well.

On-the-go usage during the day, couch gaming at nighttime


New users reflect increased revenue opportunities

As noted above, the reported shift in time spent on apps leads to more engaged attention spans at a time, which creates new monetization opportunities. Recently, SensorTower disclosed that the combined mobile gaming app store revenue on iOS and Android increased from $7.8 Bn in Q1 2016 to $11.9 Bn in Q1 2017. This equals a 53% year-over-year revenue growth. Besides different gameplay periods, users are becoming more comfortable spending money in apps, which is positively impacting mobile game revenue. SensorTower also found that download to revenue conversion on iOS has increased by 38% from January 2016 to January 2017. All of these observations lead to the conclusion that the mobile gaming industry still has high potential to drive revenue.


Mobile gaming beyond 2017 and tips for app developers

The gaming industry remains a very attractive category for app developers, especially as revenue conversions are growing. We’re seeing that longer session lengths are opening up new opportunities for innovative engagement and monetization tactics. For example, the peak usage hours on mobile devices are between 6 and 9 pm, which app developers can leverage to target specific users with acquisition or engagement campaigns.

Looking ahead, we anticipate new technologies such as virtual reality and augmented reality to open a new chapter of mobile gaming and to enhance the in-app experience as a whole. And gamers are ready: they are already having longer gameplays on their favorite gaming apps than ever.

Hands on With The New Flurry Analytics

By: Tobias Vogels (@tobyvogels), Mobile Developer Evangelist

Throughout the last several months, the Flurry team has held several webinars featuring The New Flurry. Viewers were walked-through the complete functionality of the new portal, including recently released features, and were taught how to find the metrics that are most important to them.

As mentioned before, The Classic Flurry will be retired today, March 27th, and all Flurry functionality will be served by the new Flurry platform.

Read more

U.S. Consumers Time-Spent on Mobile Crosses 5 Hours a Day

TV’s Content Jumps to “FYIS” (Facebook, YouTube, Instagram and SnapChat)

By: Simon Khalaf, SVP and Lali Kesiraju, Analytics Manager

In our annual State of Mobile report, we reported that total time-spent in mobile apps grew by 69% year-over-year. Since then, Snap Inc.’s stock soared on its first day of trading as the company disclosed that its users spend an average of 25 to 30 minutes a day in its mobile apps. In addition, YouTube announced users spend one billion hours a day watching videos and launched an OTT skinny bundle service. These events prompted us to dig deeper into mobile usage data, to see how these figures impact daily mobile activity and overall time spent.

U.S. Consumers Glued To Their Mobile Devices 5 Hours a Day

Flurry data shows that U.S. consumers continue to increase their time-spent on mobile devices.  In fact, the average U.S. consumer spends a whopping 5 hours a day on these devices. That is a 20% increase in time-spent compared to Q4 2015. Browser share on mobile, which has been steadily declining, is now only 8%, down from 9% in Q4 2015. Apps continued to reign supreme as time spent in browsers faded; and the chat-bot revolution, which was touted in 2016 as “the app killer”, simply fizzled.

US Mobile Daily Time Spent 2016

Communitainment Drives Time-Spent

A look into the data shows that 50% of time-spent is in social, messaging, media and entertainment applications. This growth has been fueled by Communitainment, or communication for the sole purpose of entertainment. Snapchat, a driver of Communitainment, especially with the fascinating growth of Snapchat, charted for the first time and now commands 2% of an average US consumer’s daily time spent. Facebook, including Instagram and Whatsapp, maintained its share of time-spent and continued to dominate the space with the addition of Facebook live and Instagram Stories. In addition, YouTube maintained its share at 3%, while independent Entertainment apps lost share, despite a 12% increase in absolute time-spent, as content, with the exception of sports and finance, migrated to YouTube, Facebook and Snapchat.

Flurry Donut Updated 3.7

Games have seen a decline in share for a second year in a row even as money keeps pouring into the category. With users more willing to spend money on apps - partially due to frictionless payment methods like Apple Pay and Android Pay - shopping apps saw a significant growth.

TV’s Content Jumps to FYIS

In November 2014, apps put TV in their rearview mirrors, as consumers started spending more time on mobile devices than traditional television sets. At that time, most of the minutes were spent on Gaming and User Generated Content (UGC). This year, the picture has changed. In addition to UGC, premium publishers started migrating their video content to social apps, such as “FYIS”.  In fact the line has completely blurred between what has traditionally been defined as premium content and UGC. In addition to this new content, “FYIS” have deployed A.I.-powered tools to constantly recommend content to consumers, creating highly personalized consumption experiences. This has led to dramatic increases in time spent in these apps.

Mobile Goes After TV’s Dollars

After taking TV’s minutes, mobile and its apps have gone after TV’s dollars. While industry analysts believed that digital would eat TV advertising dollars, more specifically, it is the cable subscriptions that mobile apps are after. With YouTube offering its first OTT skinny bundle, Hulu sneaking a peak of its planned OTT service and veterans Sling TV and DirectTV Now gaining traction, this is even more apparent. At Flurry, we believe that these offerings will further fuel mobile’s growth and will enable mobile players to siphon even more minutes from TV.

As we finished this report, the market closed and gave Snapchat an approximate 34B USD valuation, that is approximately 9% the valuation of Facebook on the same day. Snap Inc.’s share of time-spent on mobile is approximately 10% that of Facebook. This proves that the ultimate currency is not Gold, not the U.S. dollar, not the Euro, not bitcoin, nor anything we can invent. The ultimate currency is time and that time is spent on mobile.

Keys To Mobile Growth with Andrew Chen from Uber

By: Toby Vogels (@tobyvogels), Mobile Developer Evangelist

It’s #KeysToMobileGrowth time again and in this edition we had the chance to get together with Andrew Chen. Besides heading rider growth at Uber, Andrew is one of the industry’s most prominent growth thought leaders - he’s written hundreds of essays on growth and marketing. We picked his brain on what it takes to build a scalable and successful business.

image

Read more

2017 Flurry Event Line-Up: January Through April!

By: Shirin Sabahi, Developer Relations Manager

The team at Flurry has been heads down building out our series of Flurry Source workshops and PizzaBeerMobile meetups, and we’re excited to announce what we have planned for the first quarter of 2017.

Our inaugural Flurry Source will be in Bangalore, India on March 23rd. We will then shift our focus to Berlin, which will host our next workshop on April 27th. If you’re a developer based in Bangalore, be sure to RSVP here. For those of you based in Berlin, sign up here to be the first to receive details on this event! Flurry Source is a half-day event packed with great content, speakers, and product updates. We’ll bring together an all-star team of industry experts to share valuable insights trending in the mobile world.

So, what else do we have on the docket in the coming months?  In addition to announcing our PizzaBeerMobile meetups on a rolling basis (keep in touch for future event notifications in your area), this is the plan for Q1, thus far:

As a reminder, Flurry’s PizzaBeerMobile meetups are low-key gatherings where mobile-minded innovators can talk mobile - what’s trending, chat through insights, and share best practices. These events consist of a panel, short keynote, or fireside chat, followed by networking and, of course, pizza and beer.

The good news doesn’t stop there! We have also made it easier for you to keep track of our whereabouts and what cities we’re visiting next.  On our new event HQ, you can review all our upcoming events, find the one that works best for you and RSVP.

If you’re interested in applying for a speaking opportunity or partnering with us at any upcoming event, click here. If you’d like to host a PizzaBeerMobile in your backyard, please contact Shirin at: shirin@flurry.com.

We hope you’re as excited as we are for the programming lined up for 2017! We’d love for you to let us know where to go next. Be sure to Tweet us at @FlurryMobile, with the hashtags #pizzabeermobile OR #FlurrySource.

Hands-On with the New Flurry Reporting API

By Tasmin Singh (@hellotasmin), Mobile Developer Evangelist

NOTE: The old Flurry Reporting API (for both Analytics and Publishing) is slated for EOL on March 6, 2017.

 Flurry Product Director Karan Rathod led a webinar to walk us through the advantages of the new API, how to create a programatic token to access it, and how to write queries using your a tool of your choice. 

Check out the video below for a hands-on demo of how to get started! We’ve also listed some common questions and links below.

Here are some of the questions we received during the webinar that you may find helpful as well:

Q: Where do I go to set up a programatic token to access the new Reporting API?

A: Learn how to set up the programatic token here.

Q: Can I restrict a programmatic token to access data for specific apps?

A: Yes. If you have admin level access for your account then you can edit data permissions for programatic tokens.

Q: Where can I access the query builder you mentioned in the video?

A: There is one for Analytics and another for Publishing.

Q: Does the EOL of the old Reporting API affect my apps using an older version of the Flurry Analytics SDK?

A: No. There is no need to update the Flurry SDK solely for the purpose of accessing the new API. 

Subscribe to Flurry blog updates to stay on top of the latest in mobile! 

#KeysToMobileGrowth: A Look Back

By: Toby Vogels (@tobyvogels), Mobile Developer Evangelist

In this post, we will take a look back at some of the lessons learned from our interviews with some industry thought leaders in the last year. Since we started our #KeysToMobileGrowth series in June 2016, we discussed mobile strategies with seven experts from across the industry. Check out some of the expert tips to set up your app business for growth in 2017.

image

Read more